01 · RECOMMEND
Not sure where to start?
Ask the AI which analyses fit your data.
Upload your data and Skari's AI scans every column, then recommends every method from the catalog that fits — by research question, sample size, and variable types. No guesswork, no wrong tests.
- Drop your data — schema and types auto-detected
- AI lists every applicable analysis from the catalog
- Recommendations match your variables and sample size
- Pick a method and jump straight into the run
Recommendation Chat
AI Assistant
Dataset overview
Your dataset contains 428 rows and 12 variables (11 numeric, 1 categorical). Tell me about your research question — I'll recommend the best methods strictly from the catalog.
List every analysis I can run with this dataset.
With 428 observations across 12 variables, here's what fits:
I. Exploration
- • Descriptive Statistics — central tendency, dispersion of numeric variables
- • Correlation Analysis — linear relationships between numeric pairs
II. Hypothesis testing
- • Independent T-Test — compare 2 groups on a numeric outcome
- • One-Way ANOVA — compare 3+ groups (e.g., region × satisfaction)
- • Two-Way ANOVA — age_group × region interaction effect
III. Prediction
- • Multiple Regression — predict satisfaction from income, age, region
02 · SET UP
Set up & run
From upload to analysis in a few clicks.
Drop your CSV or Excel. Skari detects column types, suggests variable roles, and checks assumptions before you press analyze.
- Drop CSV or Excel — schema auto-detected
- Pick variables — Skari suggests roles
- Assumptions validated before any test runs
- Hit analyze — methods auto-selected
skari.ai / analysis
Data file
customer_survey_2026.csv
428 rows · 12 columns · 1.2 MB
Variables
auto-detectedAssumptions checked — Two-Way ANOVA ready
03 · RESULTS
Results at a glance
Summary on top, reasoning underneath.
Every report opens with the verdict — what was tested, what the data shows, and the evidence that supports it. Hover any statistical term for an instant definition.
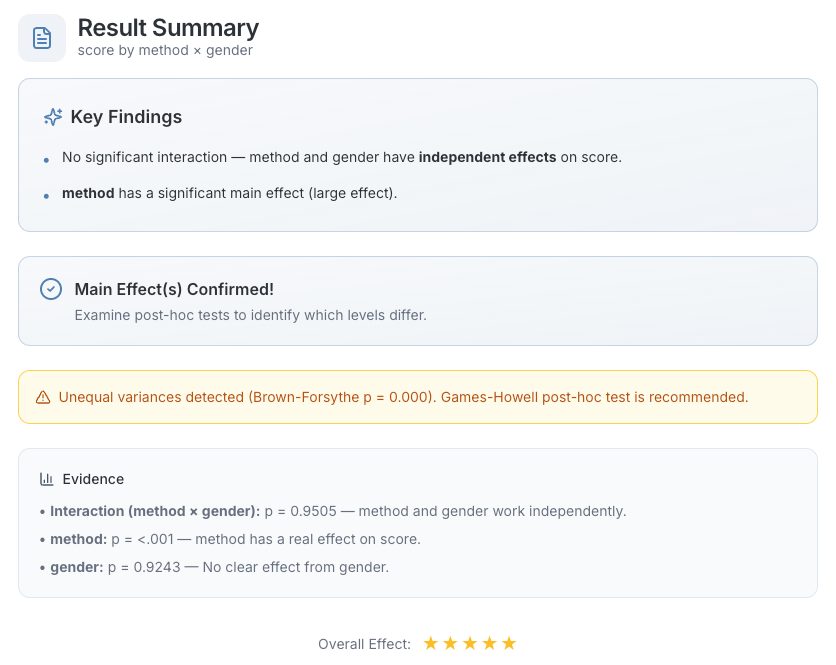
Summary — verdict, effect size, key numbers

Reasoning — assumption checks, decision logic
04 · DETAIL
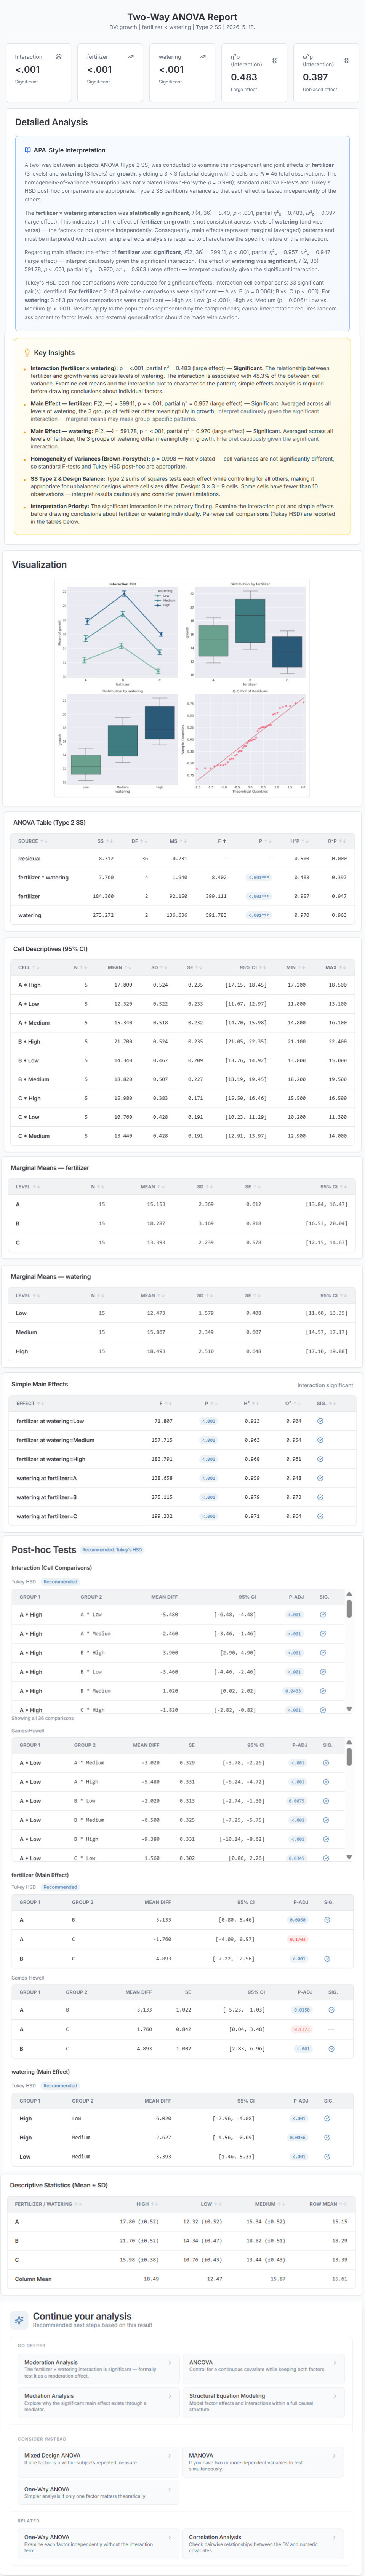
Full statistical detail
APA tables, publication-ready charts.
Everything a journal reviewer or graduate advisor needs — formatted, numbered, and exportable. Effect sizes, confidence intervals, post-hoc tests, all included.
- APA-formatted tables and figure captions
- Publication-quality charts at every step
- Effect sizes, confidence intervals, post-hoc tests
- Numbered references and methodology notes
05 · EXPORT
Take your analysis anywhere
Word report. R script. Python notebook.
Download a publication-ready Word document, or grab the underlying R and Python code to reproduce, audit, or extend your analysis in your own environment.
Word
.docx
Publication-ready report with APA tables and charts
R
.R
Tidyverse-style script that reproduces the full analysis
Python
.ipynb
Jupyter notebook with pandas/statsmodels equivalents
06 · HELP
Never stuck
AI chat, method guides, and a built-in glossary.
Ask the AI about your specific results. Open a method guide to learn when to use each test. Look up any statistical term in the built-in glossary — never leave the report to search elsewhere.
- AI Chat — Answers reference your actual analysis — not a generic textbook.
- Method Guides — When to use each test, how to interpret results, common pitfalls.
- Glossary — Statistical terms with concise, dictionary-style definitions — p-value, effect size, confidence interval, and more.
AI Tutor
onlineWhat does p = 0.023 mean for my data?
Your test returned p = 0.023, which is below the conventional 0.05 threshold. The difference between age_group A and B on satisfaction is statistically significant — only 2.3% probability it's due to chance.
Why did it pick Welch's t-test?
Two-Way ANOVA Guide
What is it?
Tests how two categorical factors jointly affect a numeric outcome — main effects + interaction.
When to use
- • Two factors (region × age)
- • Numeric outcome (satisfaction)
- • Interaction effects matter
- • Marketing A/B/n, drug × dose, etc.
Glossary
p-value —
Probability of observing the result if the null hypothesis were true. Lower = stronger evidence against the null.
Effect size —
Standardized magnitude of a difference (e.g., Cohen's d). 0.2 small, 0.5 medium, 0.8 large.
Confidence interval —
Range likely to contain the true population parameter at a given confidence level (typically 95%).
07 · CATALOG
Every method you'll ever need.
60+ analyses across 9 categories.
From t-tests to time-series forecasting and modern econometrics — every standard method is covered, with assumption checks and interpretation built in.
Descriptive
3 analyses
- ›Descriptive Statistics
- ›Frequency Analysis
- ›Variability Analysis
Assumptions
3 analyses
- ›Normality Test
- ›Homogeneity of Variance
- ›Outlier Detection
Comparison
13 analyses
- ›T-Tests
- ›ANOVA
- ›Chi-Square
- ›Non-parametric Tests
Relationship
10 analyses
- ›Correlation
- ›Linear Regression
- ›Logistic Regression
- ›Relative Importance
Predictive
7 analyses
- ›Decision Tree
- ›Random Forest
- ›Gradient Boosting
- ›Survival Analysis
Structural
6 analyses
- ›Factor Analysis
- ›PCA
- ›Reliability
- ›Mediation & Moderation
Clustering
5 analyses
- ›K-Means
- ›Hierarchical
- ›DBSCAN
- ›HDBSCAN
Time Series
9 analyses
- ›Trend Analysis
- ›ARIMA
- ›Seasonal Decomposition
- ›Exponential Smoothing
Econometrics
6 analyses
- ›Difference-in-Differences
- ›Propensity Score Matching
- ›Instrumental Variables
- ›Regression Discontinuity
ALSO IN YOUR DATA LAB
More analysis tools.
Every lab is purpose-built for a different type of analysis — same interface, different lens.
Start analyzing in 30 seconds.
Drop your data. Get a publication-ready report in minutes — not weeks.